
"If you can't read the chart, you can't make consistent profit." — This sentence captures the reality of forex trading directly. And the core charting method used by traders worldwide is the Candlestick Chart
This article will walk you through candlesticks from the basics, their components, the key patterns, all the way to how to apply them in real trading systematically
What Is a Candlestick? And Where Does It Come From
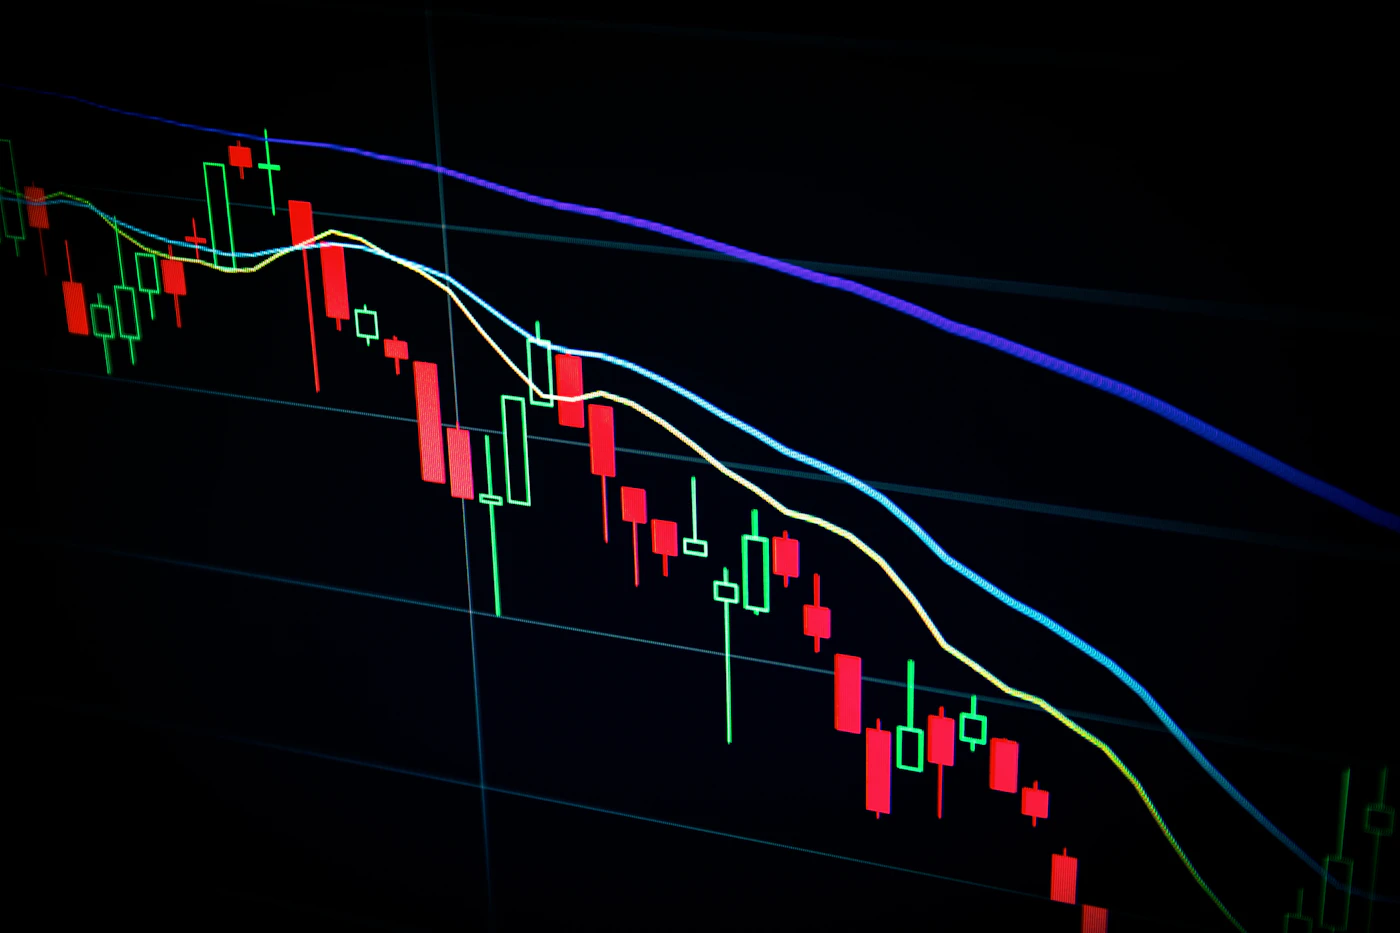
The candlestick chart was developed in Japan in the 18th century by rice trader Munehisa Homma to track rice price movements, before Western analysts adapted it for financial markets in the 1990s
Each candlestick shows 4 price values for a given time period, known as OHLC (Open, High, Low, Close):
- O — Open: the opening price for that period
- H — High: the highest price reached during that period
- L — Low: the lowest price reached during that period
- C — Close: the closing price for that period
Parts of a Candlestick
Body
The rectangular part of the candlestick that shows the distance between the opening and closing price
- Green candle (Bullish): the closing price is higher than the opening price — buyers are in control
- Red candle (Bearish): the closing price is lower than the opening price — sellers are in control
Shadow / Wick
- Upper Shadow: the thin line above the Body, showing the highest price reached before being pushed back down
- Lower Shadow: the thin line below the Body, showing the lowest price reached before being pushed back up
The length of the shadow reflects volatility and buying/selling pressure during that period. A long shadow signals a fierce tug-of-war between buyers and sellers.
5 Essential Candlestick Patterns to Know

1. Doji — A Signal of Market Indecision
A Doji forms when the opening and closing prices are equal (or nearly equal), leaving a very thin or nonexistent Body. It signals market indecision — neither side is in control — and often appears before a change in direction.
- Standard Doji: both shadows are roughly the same length
- Dragonfly Doji: short Upper Shadow, long Lower Shadow — a bullish reversal signal
- Gravestone Doji: long Upper Shadow, short Lower Shadow — a bearish reversal signal
2. Hammer & Hanging Man — Reversal Signals
Small Body near the top, with a Lower Shadow at least twice the length of the Body
- Hammer: appears after a downtrend → bullish reversal signal
- Hanging Man: appears after an uptrend → bearish reversal signal
3. Engulfing Pattern — A Strong Reversal Signal
A two-candle pattern where the second candle's Body fully "engulfs" the Body of the first candle
- Bullish Engulfing: a green candle engulfs a red candle after a downtrend → bullish signal
- Bearish Engulfing: a red candle engulfs a green candle after an uptrend → bearish signal
4. Shooting Star — A Bearish Signal
Small Body near the bottom, with a very long Upper Shadow, usually appearing after an uptrend. It signals that buyers tried to push the price higher but were overpowered by strong selling pressure.
5. Morning Star & Evening Star — Three-Candle Signals
- Morning Star: a large red candle + a Doji + a large green candle → bullish reversal signal
- Evening Star: a large green candle + a Doji + a large red candle → bearish reversal signal
How to Use Candlesticks in Real Trading
Candlesticks alone are not enough — they should always be used alongside other analysis tools
- Read the trend context: Candlesticks carry different meanings in an uptrend versus a downtrend. The same pattern can produce different signals depending on context.
- Confirm with Support & Resistance: Reversal signals that form at Support or Resistance levels are far more reliable.
- Use supporting indicators: RSI, MACD, or Volume help confirm the strength of a signal.
- Choose an appropriate time frame: H4 and Daily charts give more reliable signals than M1–M15.
- Practice on historical charts (backtesting): Before trading live, test the accuracy of a pattern on a demo account first.
Common Mistakes Beginners Make With Candlesticks
- Drawing conclusions from a single candlestick — always look at several candles in context before concluding anything
- Entering an order the moment a signal appears — wait for the candle to close first to confirm the pattern
- Ignoring the dominant trend — a strong bullish signal within a downtrend usually carries less weight
- Memorizing too many patterns without understanding the logic — understand why a pattern forms, not just what it looks like
Conclusion: Candlesticks Are a Starting Point, Not the Final Answer
Candlestick charts are a powerful tool for reading short-term market behavior, but using them effectively takes consistent practice. Study the patterns, then always test them on a demo account before trading live.
Remember that no signal is 100% accurate. Candlesticks improve the probability of a good trade, not the certainty of one. Sound risk management matters just as much as reading the chart correctly.


