
If you're new to forex trading, one of the terms you'll hear most often is “indicator”. It's a core tool that traders around the world use to analyse the market and decide when to open or close a position. This article walks you through forex indicators in detail — the definition, the main types, how to use them, and what to look for in a broker's platform that supports these analysis tools.
What Is a Forex Indicator?
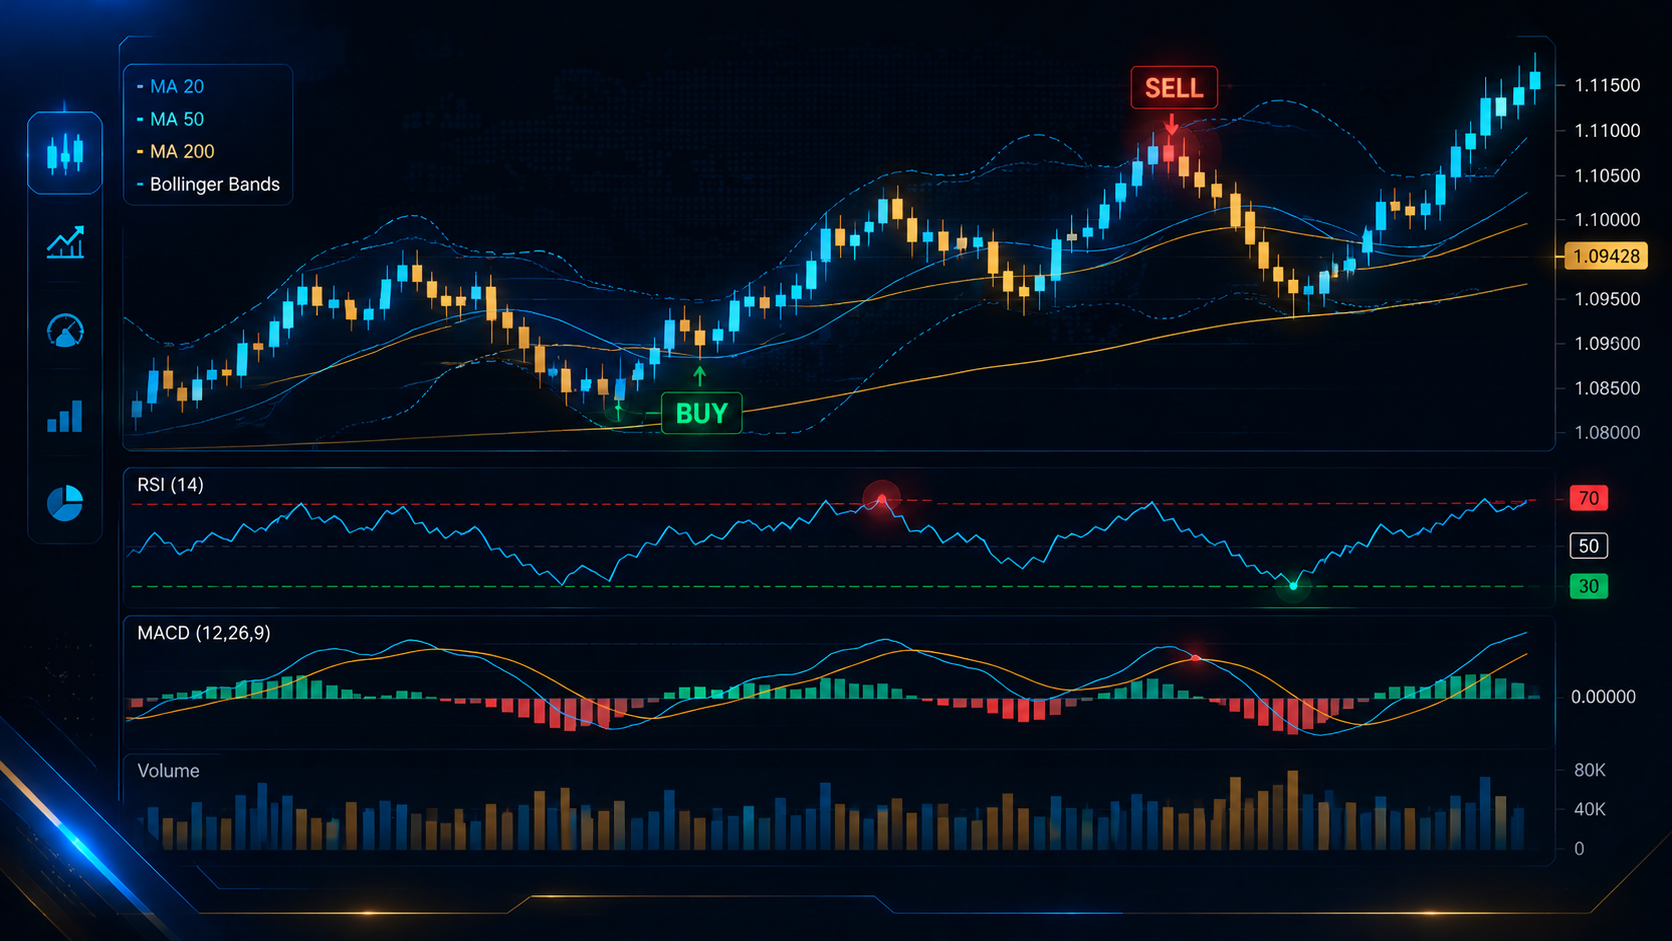
A forex indicator is a mathematical tool calculated from historical price data — open, close, high, low, and trading volume — and displayed as a chart, line, or histogram. Indicators help traders to:
- See market direction (trend) more clearly
- Judge better entry and exit timing
- Measure the strength of a trend (momentum)
- Spot overbought/oversold conditions
- Confirm buy/sell signals from other forms of analysis
In short, an indicator “translates” raw price data into a signal that's easier to read, which helps reduce emotional decision-making and makes trading more systematic.
Types of Forex Indicators
Indicators generally fall into four main categories based on what they're used for:
1. Trend Indicators
Used to identify whether the market is moving up, down, or sideways. The most common examples include:
- Moving Average (MA) — a line that smooths out price noise to show the underlying trend
- MACD (Moving Average Convergence Divergence) — tracks changes in momentum and possible trend reversals
- Parabolic SAR — marks potential reversal points, useful for setting a trailing stop
2. Momentum Indicators
Used to measure the strength and speed of price movement. Popular examples include:
- RSI (Relative Strength Index) — a 0–100 scale that flags overbought (>70) and oversold (<30) conditions
- Stochastic Oscillator — compares the closing price against the price range over a set period
- CCI (Commodity Channel Index) — used to spot reversals and emerging trends
3. Volatility Indicators
Show whether the market is moving aggressively or staying calm, useful for planning stop loss and take profit levels
- Bollinger Bands — bands that expand and contract based on volatility
- ATR (Average True Range) — the average true price range, often used to size a stop loss
4. Volume Indicators
Used to confirm how reliable a trend is, such as OBV (On-Balance Volume) and Volume Profile

Popular Indicators Every Trader Should Know
Moving Average (MA)
The most basic and arguably the most powerful indicator. Traders commonly use the 50 EMA and 200 EMA to identify medium- and long-term trends. When a shorter line crosses above a longer one, it's called a Golden Cross (a buy signal); when it crosses below, it's a Death Cross (a sell signal).
RSI (Relative Strength Index)
One of the most widely used indicators in the world. An RSI reading above 70 suggests the price may be overbought, while below 30 suggests it may be oversold. Experienced traders often pair RSI with divergence analysis to spot reversal points.
MACD
A hybrid indicator that combines trend and momentum signals. It consists of the MACD line, the signal line, and a histogram. When the MACD line crosses above the signal line, it's a buy signal; crossing below is a sell signal.
Bollinger Bands
Used to gauge volatility and spot breakout moments. When the bands squeeze together, it often signals that a sharp move is coming.
How to Choose Indicators for Your Trading Style
- Scalpers (1–5 minute trades): RSI, Stochastic, Bollinger Bands
- Day traders: MACD, EMA 20/50, ATR
- Swing traders (2–10 day trades): 200 EMA, Fibonacci, MACD
- Position traders (long-term): 200 MA, Ichimoku Cloud
The key tip: don't overload your chart with indicators, as conflicting signals can make decisions harder rather than easier. Stick to 2–3 indicators that complement each other — for example, one trend indicator, one momentum indicator, and one volatility indicator.
Comparing Brokers That Support a Full Indicator Suite
To use indicators effectively, you need a broker with a stable MT4/MT5 platform, tight spreads, and support for custom indicators. Here's a comparison of several well-known brokers:
| Broker | EUR/USD Spread | Leverage | License | Minimum Deposit |
|---|---|---|---|---|
| IUX | 0.1 pips | 1:1000 | FSC, FSA | $50 |
| Exness | 0.3 pips | 1:2000 | FCA, CySEC | $100 |
| XM | 0.6 pips | 1:1000 | ASIC, CySEC | $30 |
| FBS | 0.7 pips | 1:3000 | IFSC, CySEC | $5 |
| HFM | 0.8 pips | 1:1000 | FCA, DFSA | $50 |
As the table shows, spreads, leverage, licensing, and minimum deposits vary considerably between brokers. Tight spreads matter most for scalping and day-trading strategies that rely on real-time price signals from indicators, while higher leverage increases both potential return and risk. Compare brokers against your own strategy's needs rather than picking on a single number alone.
It's also worth noting that licenses such as FSC (Mauritius), FSA (Seychelles), and IFSC (Belize) shown above are issued by offshore regulators and provide materially weaker protections — including client-fund segregation rules and dispute-resolution schemes — than tier-1 regulators such as the FCA (UK), ASIC (Australia), or CySEC (Cyprus). The level of protection you actually get depends on which specific legal entity you open your account with, not just the broker's brand name, so always check the entity on your account-opening documents before you fund an account.
What to Look for in a Broker's Platform
- Tight spreads — keep trading costs down, especially for scalping and day trading
- Fast execution — orders processed in milliseconds help minimise slippage when acting on indicator signals
- Full MT4/MT5 support — a complete set of built-in indicators plus the ability to add custom indicators and Expert Advisors (EAs) without restriction
- Minimal requotes — the price your indicator calculates should match the price your order actually fills at
- Transparent deposits and withdrawals — clear methods and realistic processing times
Things to Watch Out for When Using Indicators
- Indicators are lagging by nature — most are calculated from past price data, so signals can lag behind what's actually happening in the market
- No indicator is right 100% of the time — pair indicators with price action and disciplined risk management
- Avoid indicator overload — too many indicators on one chart creates conflicting, confusing signals
- Test on a demo account first — backtest any indicator-based strategy before risking real money
Conclusion
Forex indicators are powerful tools that help traders read the market more systematically, reduce emotional decision-making, and improve entry accuracy. The key to using them well is choosing indicators that fit your own trading style, using them in moderation, and trading on a broker platform that's stable and reliable.


